Patience is key while Investing in equities. Build a diversified portfolio of small and mid caps by Investing in Hidden Gems and Value Picks. Click here for details.

SERVICES:        HIDDEN GEMS    |    VALUE PICKS    |    15% @ 90 DAYS    |    WEALTH-BUILDER

NANO CHAMPS (DEEPLY UNDERVALUED & UNDISCOVERED MICRO CAPS)

PAST PERFORMANCE >>> HIDDEN GEMS, VALUE PICKS & WEALTH-BUILDER >>>  VIEW / DOWNLOAD

SARAL GYAN ANNUAL SUBSCRIPTION SERVICES

Showing posts with label BSE Sensex. Show all posts

Tuesday, June 18, 2019

Facts of Investing in Small & Micro Cap Companies

Value investor Warren Buffett also falls in the inefficiency camp, claiming that individual investors should be able to earn 50% annual returns with small amounts of money because they have access to high-return small-cap stocks that he can no longer buy because of Berkshire’s huge asset size

Facts about Small Cap Companies

1.If you want out sized returns, you must invest in small-cap value stocks.

2.All ten of the top-performing stocks of the past decade were small caps and most were value stocks. We can almost guarantee that the top-performing stocks of the next decade will be small caps as well.

3.Most small caps under perform, so the key is either finding the few small caps that will produce the 30, 40, and 50-baggers, or instead buying the entire small-cap universe to insure that you won’t miss out on the big winners.

4.Small caps have above-average volatility and can under perform for long periods, so their out sized returns may require a long time frame to be realized.

5.Whether small caps are inherently more risky or just inefficiently priced is undecided, but investment prudence dictates that you normally limit your small cap allocation to less than half (some say 35%) of your total equity portfolio and avoid them altogether during incipient periods of severe economic distress.

For a stock market investor, it is financial information of the company which guides him whether he should buy or sell the company’s stock. For a micro cap stock, this information is sometimes not available since some micro cap companies do not even file their financial reports to stock exchanges. Therefore, it is hard to evaluate a micro cap company using normal technical analysis methods.

What is a micro cap stock?

A micro cap company is a company having low or micro market capitalization. The term micro-cap stock (also micro-cap) is used to describe publicly traded companies which have a market capitalization of roughly Rs. 500 crore or less. Micro cap stocks are usually not able to satisfy the eligibility criteria of being listed on major exchanges.

Micro-cap companies are known for their volatility and many such companies are involved in fraud. Since the institutional investors are rarely involved in these stocks, the stock price can be manipulated by the investors. Even though these stocks come in high risk category, investors can’t turn their eyes away from them since these can be highly profitable as well. These stocks have given higher returns than large cap stocks since last 10 years. This is the reason there are a few indices specially track the performance of micro cap stocks globally. Some of these indices are Russell Micro-cap Index, the Dow Jones Select Micro-cap Indexes, and the Dow Jones Wilshire U.S. Micro-Cap Index.

In India, BSE Small Cap Index is a well known index. BSE Small Cap Index is a composition of 865 companies. Its good to point out that most of the fortune investors invested in small/micro cap stocks in early stage of their lives, hence a small pie of your portfolio could be of small / micro cap stocks, which can have the potential to change your fortune in years to come by turning to true multibaggers creating enormous wealth.

Grow your Wealth by Investing in Hidden Gems Now!

Its a fact that 50 small and micro cap stocks out of 87 recommended by our team under Hidden Gems service during last 9 years have given more than 100% returns. Stocks like Cera Sanitaryware, Camlin Fine Sciences, Kovai Medical, Wim Plast, TCPL Packaging, Mayur Uniquoter, Roto Pumps etc are our multibagger stocks have given whopping returns in the range of 400% to 2000%.

Below are some of the Hidden Gems stocks released by us which turned out be multibaggers during last 9 years. Even after severe correction in small caps over last 1.5 years, as on date returns is in the range of 150% to 1800%.  In fact, we already advised partial / full profit booking in many of these stocks at higher levels. The update of the same was published in our Hidden Gems Flash Back report.

 HIDDEN GEMS STOCKS 
 RELEASE DATE 
 MULTIBAGGER 
OLD REPORT
1. Camlin Fine Sciences
27 Mar 2011 
8-BAGGER 
2. Wim Plast
30 Aug 2011 
5-BAGGER 
3. Kovai Medical
27 Oct 2011 
7-BAGGER 
4. Cera Sanitaryware
24 Dec 2011 
19-BAGGER
5. Mayur Uniquoter
31 Mar 2012 
5-BAGGER 
6. Roto Pumps
05 Aug 2012 
7-BAGGER 
7. Acrysil
25 Nov 2012 
5-BAGGER 
8. TCPL Packaging
31 Mar 2013 
5-BAGGER 
9. Rane Brake Lining
31 May 2014 
3-BAGGER 
10. Dynemic Products
29 Jul 2014 
2.5-BAGGER
11. Mold-Tek Packaging
22 Mar 2015 
2.5-BAGGER 
12. Visaka Industries
05 Jul 2015 
3-BAGGER 
13. Chemfab Alkalies
06 Sep 2015 
2.5-BAGGER 
14. Ultramarine Pi.
11 Oct 2015 
2.5-BAGGER 
15. Stylam Industries
08 May 2016 
3-BAGGER 

Post election outcome, Sensex & Nifty made all time high and delivered positive returns of ~15% since Jan 2018 where as broader markets i.e. Small Cap and Mid Cap indices delivered negative returns of 29% and 20% respectively during the same period. Most of the liquidity in small & mid caps has dried up and found its way to large caps over last 1.5 years. At this juncture, large caps looks fairly valued or expensive in terms of valuations, however small & mid cap companies look attractive and can reward long term investors in big way. In fact, some of the worst times to get into the market turned out to be the best times for long term investors and same seems to be applicable now for small & mid caps.

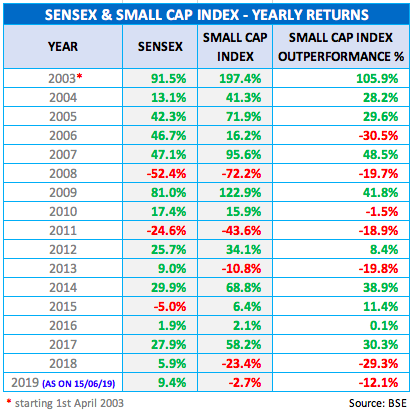
Small Cap Index has not delivered negative returns for 2 consecutive years in past 16 years

We believe this is a blessing in disguise because for the first time in many years, several small companies having robust business fundamentals are available at attractive valuations. Do you know in last 16 years, small cap index have not given negative returns for 2 consecutive years. In 2018, BSE Small Cap Index has given negative returns of -23.4% and since beginning of this year, index is down by another -4.4%. Below is the table which indicates Small Cap Index returns YoY since 1st April 2003 (the data is available from April 2003 onwards only in BSE).
BSE Small Cap Index 15 years yearly return table
Whenever, Small Cap Index delivered significantly high negative returns in a particular year during last 16 years, it has delivered double digit positive returns the very next year. The divergence between Sensex / Nifty and Small & Mid Cap Index will not last for long going forward considering valuations gap emerging between large caps in comparison to mid & small cap stocks.

Tide to turn favourable sooner than later for small cap stocks

If you analyse the bear phase of stock markets cycle since 1990, you will find that such bear phase has not lasted for more than 18 months. Small cap index which made high in Jan 2018 with end of its bull run corrected by -35% from its peak of 20,184 in Feb 2019 and we believe bottom in broader markets is already in place with lows made in Feb 2019 post Pulwama attack.

Greed which was seen in broader market (small & mid caps) in the year 2016 and 2017 has turned to fear these days. Are you also fearful? This is the time to do opposite of the herd, its time to be greedy when others are fearful. If you are not investing in equities during these opportune times and taking the back seat, you are making a bigger mistake.

Remember, in the long run, you do not make decent returns on your investments by following the herd i.e. when everyone is buying stocks; instead you get handsome returns on our investments by investing in stocks at significantly low prices as no one else is buying, and by selling to them when they come back in herd due to greed in future.

Be a disciplined investor who keep on investing in systematic way irrespective of market conditions and not an emotional investor who usually buy stocks during bull phase when stock prices are moving higher because of greed and sell them in panic during bear phase due to severe fall in stock prices, making mistake of buying high and selling low.

Monday, June 17, 2019

Multibagger Small Caps & The Retail Investors

Multibagger Small Cap Stocks & The Retail Investors

Most of the retail investors keep themselves away from investing in small and little known companies which they never heard of and find themselves comfortable investing in companies which they are aware and keep a close watch on price movement instead of looking at important parameters like recent performance of the company, its quarterly results, debt on books, earning per share, dividend yield, PE ratio, ROE ratio etc along with future prospects considering macro and micro environment for the industry to which stock belongs to.

The aversion towards this category will be more evident in the present context when there is gloom, both at the domestic and global front. The prevailing negative sentiments have made stock market investing a nightmare for all those who have parted with their hard earned savings into this sector, fondly called the barometer of the economy.

However, at this juncture, we would like to differ from the general view and recommend risk taking investors not to follow the herd but rather they can consider taking a small exposure into the small cap stocks.

Small cap stocks offer a lot of potential to generate additional return in your portfolio. Experts and Guru's of stock market should put in extra effort to create more awareness about benefit of investing in small cap stocks during choppy markets. Actually there is a need to calm down the investors during market downturns and advise them on the positives of investing into this category when markets are range bound.

Below is the table illustrating the % returns delivered by Sensex as well as BSE Small Cap Index every calendar year since 1st April 2003.
Small Cap stocks are known to deliver impressive performance when bulls rule the markets, but they get battered during a bearish regime. For instance in 2009, Sensex was one of the best performing markets vis-a-vis its peers. This was on account of the positive impact of the stimulus released by the Government and the election results, which led to confidence among investors and corporate India that a stable government at the centre will be able to bring in a lot of reforms. This saw the index posting a superb return of 81% while the BSE Small Cap Index actually delivered an impressive 123% during the same time horizon.

This could be attributed to the fact that during market upturns small cap companies normally outperform their larger peers, since the latter would have already reached their peak in terms of the potential to grow in the future, while the former actually gets to unlock its growth potential as there is a long way for them to reach the maturity stage.

Similarly, if we look at performance of various indices in 2014, Sensex has given returns of 29.9%, however BSE Small Cap Index has given whopping returns of 68.8% during the same period. In fact, 2014 was one of the best year for small cap companies after 2009 as many little known companies with good fundamentals turned multibagger during this year itself.


Looking at current scenario, Sensex has made all time high of 40,312 recently on 4th June and closed at 38,961 today. However, Small Cap Index closed at 14,173 today and is still down by almost -30% from its all time high of 20,183 made on 15th Jan 2018. Money has moved from small caps to large caps during last 1.5 years, this has pushed the Sensex to life time high leaving small cap companies to their 52 week lows. Negative sentiments towards small caps have  not only brought down companies with poor fundamentals down but also the fundamentally good businesses at historically low valuations. Hence, buying right set of small caps with robust business fundamentals now can be an excellent wealth creating multibagger opportunity in long run.


There are a lot of reasons why investors should not directly get into small cap stocks as some of them can be illiquid and concerns may arise about the way the company is being professionally managed. Moreover, these companies have limited media coverage and they are largely unknown among investors, which means the information in public domain will be very limited.

Investors who want to invest in small cap stocks should go by advise of professionals who have the expertise to spot these hidden gems. We believe that with BSE Small Cap Index trading nearly 30% below its all time high, this is the right time to get into small cap stocks. However, this category is recommended only to investors who are ready to take the extra risk to get the additional upside in their portfolio and also have the patience to wait to reap the benefits.

Tuesday, October 22, 2013

Can Sensex Achieve Target of 1,00,000 by 2020?

Sensex Target of 1,00,000 by 2020

In view of the fact that the BSE Sensex has yielded an internal rate of return (IRR) of 17.25 percent since its inception in 1979, the chances of it hitting the 1,00,000 level over this decade is quite possible. Below are some facts and figures which justify such possibility and give some insight on long term Sensex targets.

1. Over a period of the past 30 years i.e. 1979-2009, BSE Sensex has yielded in IRR of 17.25 percent per annum. If history can form any basis for the future and if the historic average IRR of 17.25 percent per annum has to be maintained, the Sensex will reach whopping high levels of 1,00,000 or more by 2020.

2. If we look at the commencement of bull phase of the indian capital markets i.e. from 2003 onwards, the BSE Sensex has yielded an IRR of 26.21 percent per annum. If such an IRR of 26.21 percent has to be maintained, the sensex has to reach a level of 2,23,000 by 2020.

3. If we look at sensex targets by 2050 i.e. after 4 decades from now with an IRR assumption of 17.25 percent per annum, we will see sensex at 1,17,50,000 (1 Crore seventeen lakh fifty thousand)

4. If we have a bull phase for 4 decades, an IRR assumption of 26.21 percent per annum, sensex shall be at 24,05,77,897 (24 Crores plus)

We do not have any idea what is there in store for indian markets in this decade or century. If anybody gets a feeling that the indicative sensex levels discussed here is hypothetical and out of reach, we won't complain because the indicative levels surely are sounding exaggerated. This is done assuming that all the 30 sensex companies are going to contribute to it in line with their respective weightage.

However, it leaves us wondering if equities can't even yield 17.25 percent per annum IRR during this decade because that is the period which is widely accepted to be the "decade of India".

Friday, October 26, 2012

Can Sensex Achieve Target of 1,00,000 by 2020?

Sensex Target of 1,00,000 by 2020

In view of the fact that the BSE Sensex has yielded an internal rate of return (IRR) of 17.25 percent since its inception in 1979, the chances of it hitting the 1,00,000 level over this decade is quite possible. Below are some facts and figures which justify such possibility and give some insight on long term sensex targets.

1. Over a period of the past 30 years i.e. 1979-2009, BSE Sensex has yielded in IRR of 17.25 percent per annum. If history can form any basis for the future and if the historic average IRR of 17.25 percent per annum has to be maintained, the sensex will reach whopping high levels of 1,00,000 or more by 2020.

2. If we look at the commencement of bull phase of the indian capital markets i.e. from 2003 onwards, the BSE Sensex has yielded an IRR of 26.21 percent per annum. If such an IRR of 26.21 percent has to be maintained, the sensex has to reach a level of 2,23,000 by 2020.

3. If we look at sensex targets by 2050 i.e. after 4 decades from now with an IRR assumption of 17.25 percent per annum, we will see sensex at 1,17,50,000 (1 Crore seventeen lakh fifty thousand)

4. If we have a bull phase for 4 decades, an IRR assumption of 26.21 percent per annum, sensex shall be at 24,05,77,897 (24 Crores plus)

We do not have any idea what is there in store for indian markets in this decade or century. If anybody gets a feeling that the indicative sensex levels discussed here is hypothetical and out of reach, we won't complain because the indicative levels surely are sounding exaggerated. This is done assuming that all the 30 sensex companies are going to contribute to it in line with their respective weightage.

However, it leaves us wondering if equities can't even yield 17.25 percent per annum IRR during this decade because that is the period which is widely accepted to be the "decade of India".

We strongly believe that time has come to build equity portfolio as business cycle is reviving and in coming years, equities can outperform all other asset class. Annualized returns of 15-18% can be achieved by major indices for next couple of years. This may be our conservative estimates, who knows if we resume similar bull run like what we have seen in period of 2003 to Jan 2008, we can easily see Sensex crossing 50,000 by 2015.

Read More >>> Stellar Performance: 5 Hidden Gems of 2011 have given 100% plus ROI

Tuesday, June 19, 2012

Can Sensex achieve Target of 1,00,000 by 2020?

Sensex Target of 1,00,000 by 2020

In view of the fact that the BSE Sensex has yielded an internal rate of return (IRR)of 17.25 percent since its inception in 1979, the chances of it hitting the 1,00,000 level over this decade is quite possible. Below are some facts and figures which justify such possibility and give some insight on long term sensex targets.

1. Over a period of the past 30 years i.e. 1979-2009, BSE Sensex has yielded in IRR of 17.25 percent per annum. If history can form any basis for the future and if the historic average IRR of 17.25 percent per annum has to be maintained, the sensex will reach whopping high levels of 1,00,000 or more by 2020.

2. If we look at the commencement of bull phase of the indian capital markets i.e. from 2003 onwards, the BSE Sensex has yielded an IRR of 26.21 percent per annum. If such an IRR of 26.21 percent has to be maintained, the sensex has to reach a level of 2,23,000 by 2020.

3. If we look at sensex targets by 2050 i.e. after 4 decades from now with an IRR assumption of 17.25 percent per annum, we will see sensex at 1,17,50,000 (1 Crore seventeen lakh fifty thousand)

4. If we have a bull phase for 4 decades, an IRR assumption of 26.21 percent per annum, sensex shall be at 24,05,77,897 (24 Crores plus)

We do not have any idea what is there in store for indian markets in this decade or century. If anybody gets a feeling that the indicative sensex levels discussed here is hypothetical and out of reach, we won't complain because the indicative levels surely are sounding exaggerated. This is done assuming that all the 30 sensex companies are going to contribute to it in line with their respective weightage.

However, it leaves us wondering if equities can't even yield 17.25 percent per annum IRR during this decade because that is the period which is widely accepted to be the "decade of India".

Wednesday, November 3, 2010

Sensex Outperforms Gold in Last One Year

On Dhanteras today, you might bought gold like thousands of other Indians. But would it make you wealthier than other investments?

Not necessarily, if you look at recent history.

Of course, it all rests on the timing. Even though there have been many headlines about how high the gold price has risen, you would have become wealthier had you bought Indian stocks or equities a year ago compared with gold.

The Bombay Stock Exchange's 30-share Sensitive Index has gained 32% in the 52 weeks through Tuesday, while gold's spot price in rupee terms is up 23%, according to the Bombay Bullion Association.

India's stock market has benefited from large investments by foreign investors, who have been looking for high-performing stock markets around the world. They find India attractive, thanks to its projected annual economic growth rate of more than 8% and fast-growing companies. So far this year, foreign institutional investors have poured $24.5 billion into Indian stocks.

However, it has not all been smooth sailing. In the early months of this year, for instance, some large investors got jittery and pulled money out of Indian stocks, causing the Sensex to fall. They came back several weeks later, leading to gains.

In contrast, gold prices have been relatively less volatile.

But like stocks, gold prices, too, have been dependent on foreign investors. The physical demand for gold, for use in industries or jewelry, has not jumped in recent years.

Instead, large investors in the U.S. and in other parts of the world are hoarding gold because they are worried that there could be another economic setback in America or other European countries. In such a scenario, stocks could lose value and gold typically gains value because it's considered a "safe" investment and a currency of last resort.

Also, in the last few years, central banks around the world have printed a lot of new money, some of which has been used by investors to buy gold. This all has pushed up the gold price.

So, where should you invest your money now?

In both stocks and gold, though in varying degrees and with different goals.

Buy stocks for growth over the long-term but be prepared for volatility. We believe that the Indian stock market will continue to do well over the next several years as Indian companies continue to grow rapidly. Decades of bull market has been already been experienced by developed countries like US and Japan. For India, this could be an start of multi years bull run. 

We expects that profits of Indian companies could grow by more than 20% a year in the near future. Stocks could deliver more than 15% per annum over the next few years on the back of strong corporate earnings growth.

Typically, stocks should form a major part of an investor's portfolio – between 50% and 65% of your investments if you can handle moderate risk.

Gold, on the other hand, has not been a high-return investment over the long-term but it can protect a portfolio from massive losses over periods of time.

Given that fears about the global economy still abound, if global markets collapse or stocks lose value for another reason, typically gold will gain. This is what happened in 2008 when stocks fell by around 50% but gold gained in value.

We suggest that individuals put around 10% to 20% of their portfolio in gold, typically through gold exchange-traded funds, a type of fund which trades like a stock. Gold ETFs aim to track the daily spot price of gold and ETF providers use your investment to buy equivalent gold and keep it with a bank or custodian.

Sunday, September 19, 2010

Sensex Inching Towards All Time High Zone

We expect the market to remain firm as even advance tax numbers were higher than that of last year, with the positivity from the global front, we are steadily approaching near the all-time high zone and are likely to extend the up move in the coming weeks with required consolidation for the sustainable move.

In the past week, Indian markets continued their strong momentum and scaled new highs. The Sensex and Nifty reached levels last seen in January, 2008, backed by robust inflows from FIIs.

The momentum of the market has been very strong. It is likely to remain so unless there is any significant negative development in the global space. 

Profit-booking cannot be ruled out in the coming days, as the market has risen very fast in recent sessions and many blue-chip stocks are trading at lifetime high levels. However, those corrections should be taken as an opportunity to get into the market.

The market would be keenly watching the meeting of the US Federal Reserve scheduled on September 30. The US Federal Reserve is expected to launch a stimulus package at its meeting, seeing the worrisome situation of high unemployment and weakness in construction activity as indicated by the latest Fed Beige book finding. Though any rate hike is not expected, assessment of the economy and indication of future steps would be important for market direction.

The market remained positive in four out of five trading days in the previous week.

The Sensex ended the week at its best level since January 17, 2008. During the week, the Sensex recorded a gain of 4.2 per cent, its best weekly rise so far this year. The market is sustaining the rally as inflows from overseas investors is coming in relentlessly and in the coming days too, this rising spree is likely to continue.

FIIs infused a whopping Rs 11,300 crore (or $2.43 billion) into domestic equities in the first fortnight of the current month, taking their total investment so far to over Rs 70,000 crore.

Tuesday, August 31, 2010

Performance of BSE Sensex & BSE Mid Cap Index

The BSE-Sensex has been trading in the range of 16,000 to 18,000 for almost a year now. It is only in the past few trading session that it has managed to stay above the 18,000 mark. However, purely going by valuations, the general consensus is that the markets seem overvalued. And it has remained in the ‘slight expensive' zone over the past year as well. Hence, the rangebound movement in the index.

But what does this indicate for the midcap stocks, whose representative index (the BSE-Midcap Index) is benchmarked against the BSE-Sensex?

Below we have displayed a comparative data for both the indices - BSE-Sensex and BSE-Midcap index.

Data Source: CMIE Prowess

If one had invested Rs 100 at the beginning of 2008 in the BSE-Sensex and the BSE-Midcap indices each, it would have been worth Rs 90 and 79 respectively. This indicates that the Sensex has outperformed the BSE-Midcap Index over this two and a half year period. However, the BSE-Midcap Index has by far outperformed the BSE-Sensex over the last year as well as during the year till date (YTD; January 1 2010 to August 24 2010). While the BSE-Sensex has risen by 17% over the last year, the BSE-Midcap Index has risen by 37%. As for the YTD comparison, the BSE-Sensex is up by 5%, while the BSE-Midcap Index is up by 17%.

However, the best way to gauge the attractiveness of midcap stocks is to look at their price to earnings ratio (PE). A batter way to gauge the same is by comparing the valuations of the BSE-Midcap Index with the benchmark index, the BSE-Sensex.

Below is a chart indicating the PE ratios of both the indices since 2008. We have also shown the average PE ratios of both these indices during this two and a half year period (prior period data was not available at this time).
Data Source: CMIE Prowess

Well, considering that the BSE-Sensex is trading at a price to earnings of about 21.8 times, it seems to be a tad on the expensive side (as compared to its long term average valuation of about 16 to 17 times). With this, the BSE-Midcap Index's valuations seem to be quite reasonable.

There is no doubt that the BSE-Midcap Index would trade at lower valuations as compared to the BSE-Sensex, the main question is that despite this, are midcaps attractive at this point in time?

Mid cap stocks if carefully selected from promising sectors with reasonable valuations can broadly out perform large cap stocks in medium to long term. Mid caps always play a key role in capital appreciation for investors with aggresive equity portfolios. In aggressive equity portfolio's, equity allocation for mid cap stocks can be as high as 60 to 70 percent.

Saral Gyan offers Value Picks - Research report of mid cap stocks with plenty of upside potential.

Wednesday, June 23, 2010

BSE Sensex

Sensex is the value-weighted index of the companies listed on the stock exchange. Bombay Stock Exchange (BSE) in 1986 came out with a stock index that subsequently became the barometer of the Indian stock market. Sensex is a basket of 30 constituent stocks representing a sample of large, liquid and representative companies. That's why it's also known as BSE 30 Sensex. The base year of sensex is 1978-79 and the base value is 100.

Sensex is calculated using the "Free-float Market Capitalization" methodology. As per this methodology, the level of index at any point of time reflects the Free-float market value of 30 component stocks relative to a base period. The market capitalization of a company is calculated by multiplying the price of its stock by the number of shares issued by the company. This market capitalization is further multiplied by the free-float factor to determine the free-float market capitalization.

What is Free-float Methodology

Free-float methodology is an index construction methodology that considers only the free-float market capitalization of a company for the purpose of index calculation. Free-float market capitalization considers only those shares issued by the company that are readily available for trading in the market. It excludes promoters' holding, government holding, strategic holding and other locked-in shares that will not come to the market for trading in the normal course.

Scrip Selection Criteria for BSE Sensex

Listed History: The scrip should be listed at BSE for a minimum of 3 months. Exception can be made if full market capitalization of a newly listed company ranks among top 10 in the list of BSE. In case, a company is listed on account of merger/ demerger/ amalgamation, minimum listing history would not be required.

Trading Frequency: The scrip should have been traded on each and every trading day in the last three months at BSE. There can be exceptions in case of extreme reasons like scrip suspension etc.

Final Rank: The stock should figure among the top 100 companies listed by final rank. The final rank is calculated by assigning 75% weightage to the rank on the basis of three-month average full market capitalization and 25% weightage to the liquidity rank based on three-month average daily turnover & three-month average impact cost.

Market Capitalization Weightage: The minimum weightage of each scrip in SENSEX based on three-month average free-float market capitalization should be 0.5% of the Index.

Industry/Sector Representation: Scrip selection is generally based on a balanced representation of the listed companies in the universe of BSE.

Track Record: The company should have an acceptable track record.